Hi Geeks,
For a customer who has about 1500 users, I have designed a SCCM 2012 Platform using a single primary site since there is no a subordinate important site (to use it as secondary site or another primary site) with the these elements :
- A site server on a DL 360 G7
- A site system server with duplicated roles on a DL 360 G7
- 2 SQL Servers configured used Always On feature on 2 DL 360 G7
All right for 1500 users, the proposed architecture is highly available. However, the customer has changed his opinion: The SCCM Is so critical for him ans desires to get it on the Secondary site.
My challenge was with the same servers, I had to find a solution since SCCM 2012 does not support Disaster Recovery capabilities.
So I have thought a bout virtualization to offer :
- High availability through a Hyper-V cluster
- Disaster Recovery capabilities through Hyper-V Replica
The architecture has changed and the following schema describes the involved elements :
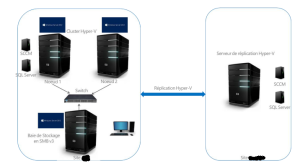
- 2 servers used as Hyper-V Cluster Nodes. Each node can host two machines : SCCM (a primary site server), SQL ( configured also as a site server with some duplicated roles)
- 1 server as SAN (Yes!). The cluster was based on SMB 3!
- 1 server as Hyper-V replica
Very nice! The designed architecture was deployed successfully (ElhamdouliLLah). However, I have encountered some issues with the Hyper-V replication that works fine locally but with big disruptions over the WAN.
My problem is I was not able to estimate the necessary ressources (WAN bandwidth especially) for my workload.
Fortunatly, Microsoft has released this great tool ; Capacity Planner for Hyper-V that can be downloaded from this link.
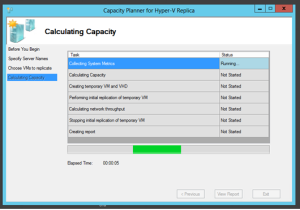
After configuring and running the tool, it is possible to consult a rich report that covers (from the tool documentation) :
1) Virtual Machine:
The table lists a set of VMs and VHDs which were considered for capacity planning guidance.
2) Processor
The table captures the estimated CPU impact on the primary and replica servers, after enabling replication on the selected VMs.
3) Memory
The table captures the estimates memory requirements on the primary and replica servers, by enabling replication on the selected VMs
4) IOPS
There are two tables in this section – one for the primary storage subsystem and the other for the replica storage subsystem. The attributes for the primary storage subsystem are:
a) Write IOPS before enabling replication – This captures the write IOPS observed across all the selected VMs for the duration of the run
b) Estimated additional IOPS during initial replication – Once replication is enabled, the VHD is transferred to the replica server/cluster as part of the ‘Initial Replication’ (IR) operation which can be completed over the network. The IOPS required during this duration is captured in this row.
c) Estimated additional IOPS during delta replication – Once IR completes, Hyper-V Replica attempts to send the tracked changes every 5 minutes. The additional IOPS required during this operation is captured in this row.
The attributes for the replica storage subsystem are:
a) Estimated IOPS during IR – During the course of IR, the IOPS impacts on the replica storage subsystem is captured in this row
b) Estimated IOPS when only the latest point is preserved – While enabling replication, customers will have an option to store only the recovery point or upto 15 additional recovery points (which are spaced at a 1 hour granularity). This row captures the IOPS impact when storing only the latest recovery point.
c) Estimated IOPS impact when multiple recovery points are used – This row captures the IOPS impact when replication is configured to store multiple recovery points. Hyper-V recovery snapshots are used to store each recovery point. The IOPS impact is independent of the number of points.
5) Storage
This section captures the disk space requirements on the primary and replica storage. The first table which captures the primary storage subsystem contains the following details:
a) Additional space required on the primary storage: Hyper-V Replica tracks the changes to the virtual machine in a log file. The size of the log file is proportional to the workload “churn”. When the log file is being transferred (at the end of a replication interval) from the primary to the replica server, the next set of “writes” to the virtual machine are captured in another log file. This row captures the space required across all the ‘replicating’ VMs
b) Total churn in 5minutes: This row captures the workload “churn” (or the writes to the VM) across all the VMs on which replication will be enabled.
The following metrics are reported on the replica storage:
a) Estimated storage to store the initial copy: Irrespective of the replication configuration around additional points (latest vs storing more than one point), this row, captures the storage required to store the initial copy.
b) Additional storage required on the replica server when only the latest recovery point is preserved: Over and above the storage required to store the initial copy, when replication is enabled with only the latest point, the tracked changes from the primary server are written to the replica VM directly. Storage (which is equal to the churn seen in a replication interval) is required to store the log file before writing to the replica VM.
c) Additional storage required per recovery point on the replica server when multiple recovery points are preserved: Over and above the storage required to store the initial copy, each additional recovery point (which is stored as Hyper-V snapshot on the replica server) requires additional space which is captured in this row. This is an estimate based on the total VHD size across all the VMs and the final size is dependent on parameters such as write pattern.
6) Network
The network parameters are captured in the table. These are:
a) Estimated WAN bandwidth between the primary and replica site: This is the input provided to the capacity planning tool.
b) Average network bandwidth required: Based on the workload churn observed during the duration of the run, this row captures the average network bandwidth required to meet Hyper-V Replica’s attempt at sending the tracked changes every 5 minutes. This is a rough estimate as factors (which are not accounted by this tool) such as compression of the payload, latencies in the network pipe etc could impact the results.
c) MaximumActiveTransfers: In a multi-VM-replication scenario, if the log file for each of the replicating VM is transferred sequentially, this could starve or delay the transmission of the change log file of some other replicating VM. On the other hand, if the change log file for all the replicating VMs are transferred in parallel, it would affect the transfer time of all the VMs due to network resource contention. In either scenario, the Recovery Point Objective (RPO) of the replicating VMs is affected. An optimal value for the number of parallel transfers is got by dividing the available WAN bandwidth by the TCP throughput of your link. The tool calculates the TCP throughput by replicating the temporary VM which is created and makes a recommendation for a registry key which is taken into account by Hyper-V Replica. It is worth noting that the value captures the number of parallel network transfers and *not* the number of VMs which are enabled for replication.
A great tool really!


